MZI circuit layout generation in Jupyter notebook
Belows are steps to create Jupyter Notebook on VScode environment, running a Jupyter notebook is free on VScode, however if you are designing on PyCharm, only Pycharm Pro supports Jupyter Notebook.
Create a Jupyter Notebook
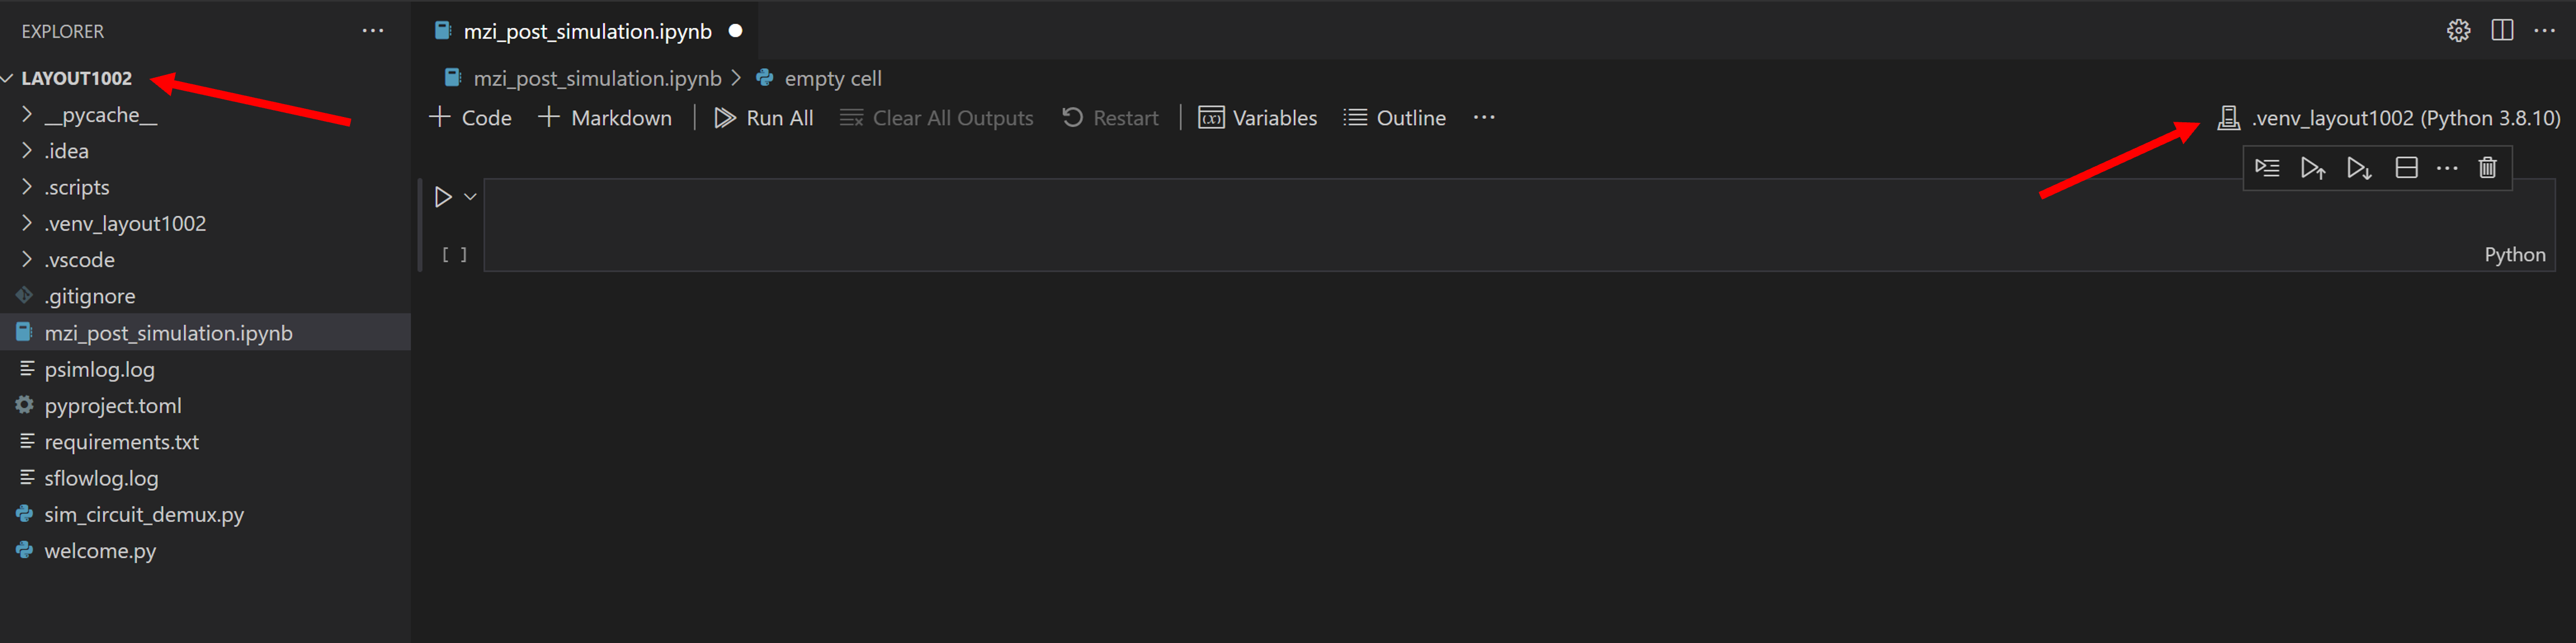
First, we have to create a Jupyter Notebook by running the Create: New Jupyter Notebook command from the Command Palette (Ctrl+Shift+P) or by creating a new .ipynb file in your workspace. Note: The ``ipynb`` file has to be create under the folder ``LAYOUT100X``, so that the kernel and language will be correct for running PhotoCAD
Code cell & Markdown cell
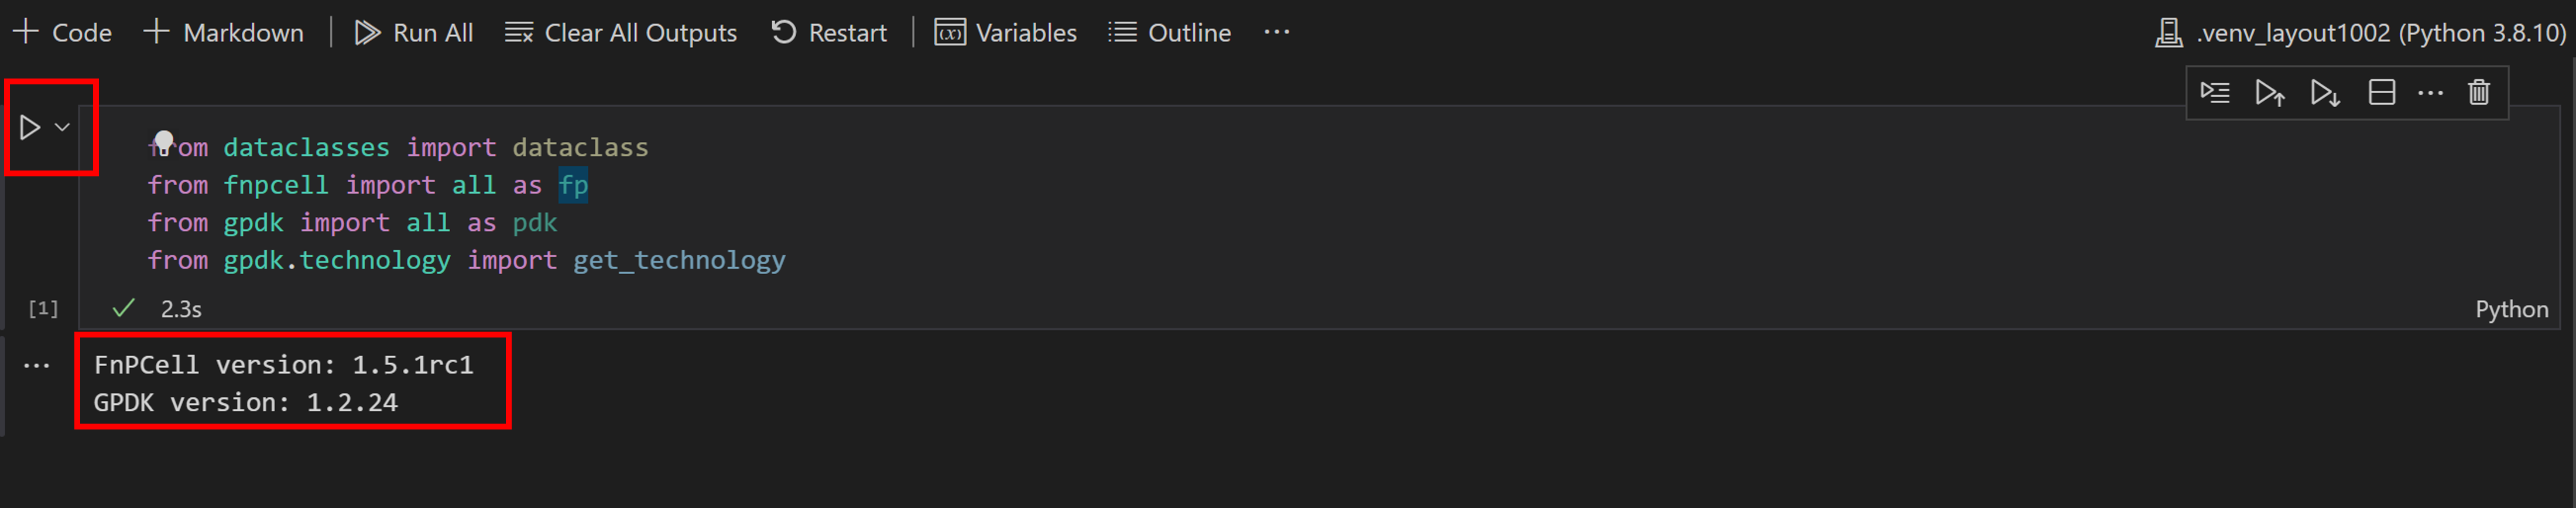
In code cell mode, users are allowed to script Python code and run a single cell using the Run icon to the left of the cell and the output will be displayed below the code cell.
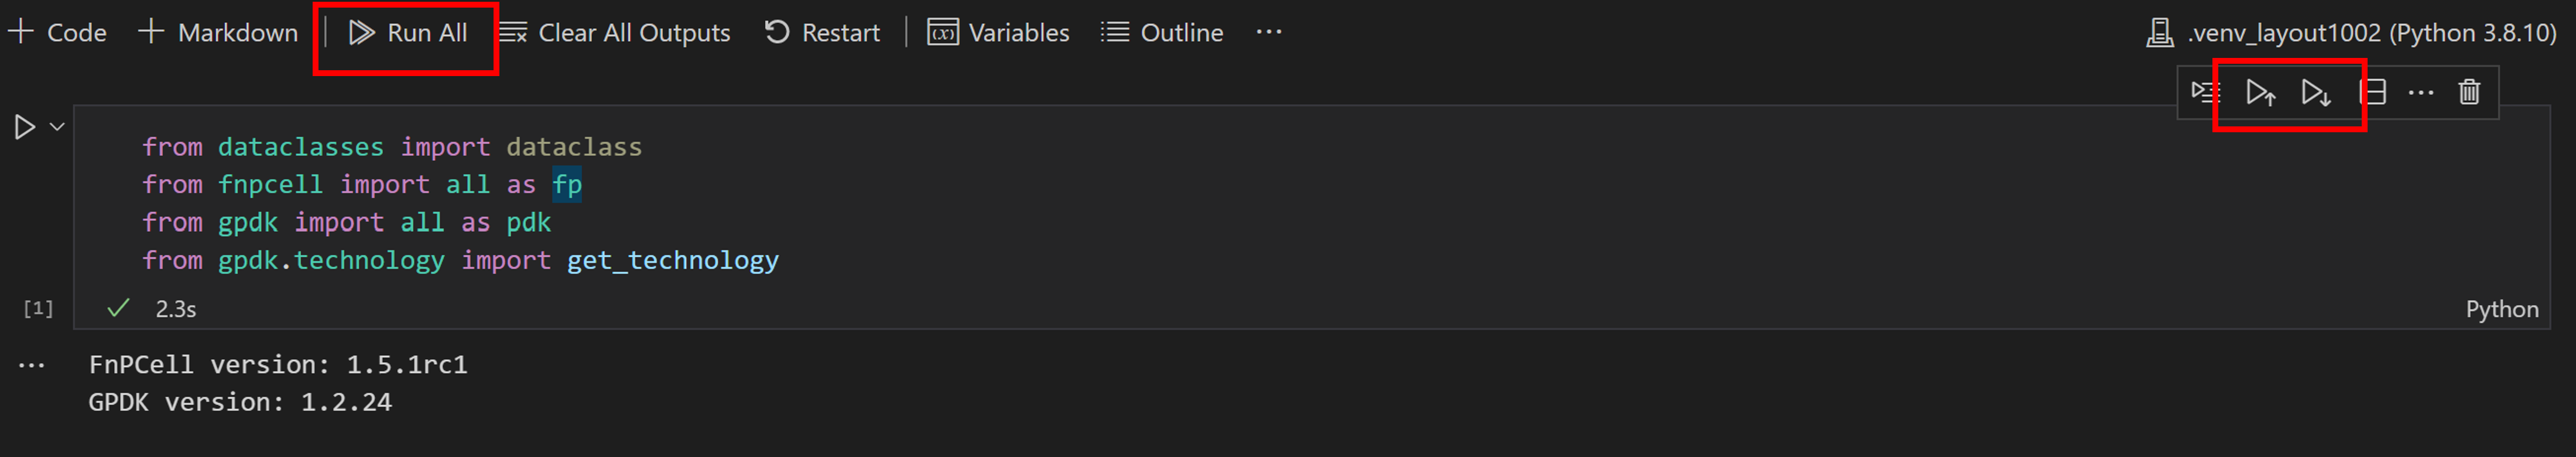
Running multiple cells is also possible by using the double arrow in the main toolbar of the Notebook editor to run all cells within the Notebook or the Run icons with directional arrows in the cell toolbar to run all cells above ot below the current code cell.
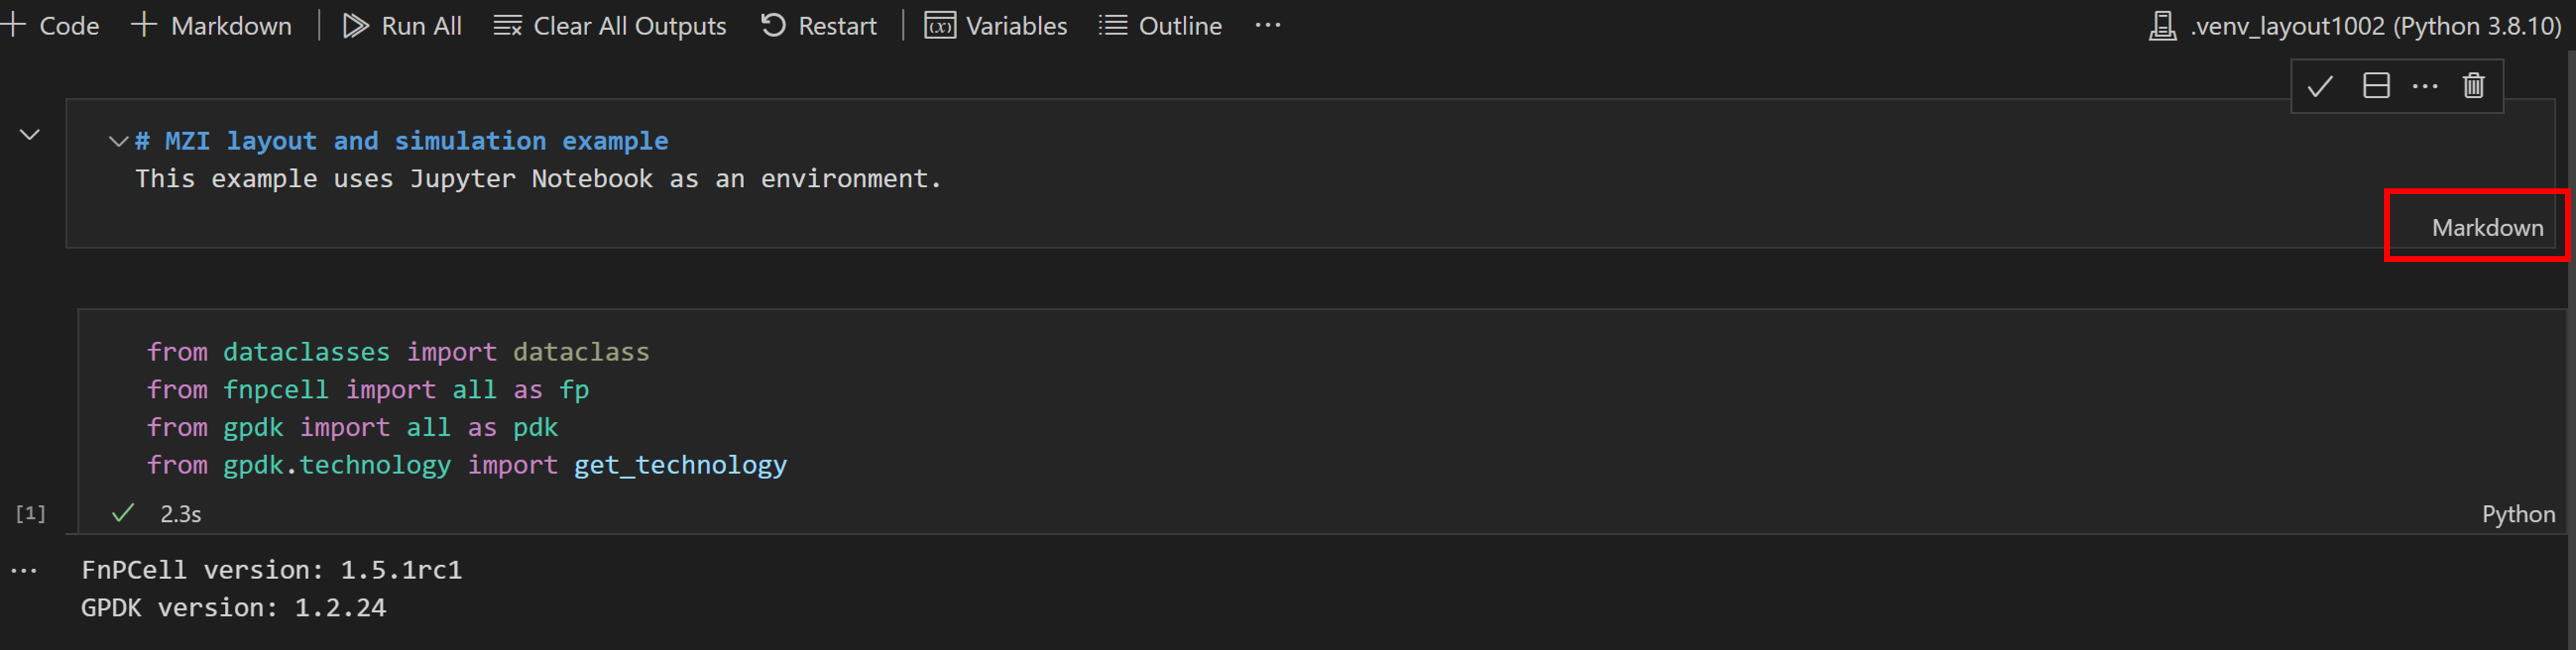
In Markdown cell mode, we can write content in the cell to provide information or notification to the cell codes. After selecting the check mark or use the shortcut Ctrl+Enter, the Markdown cell will transform into contents.
Generate MZI layout
Import function packages
Run the code cell and it will tell you the version of
PhotoCAD.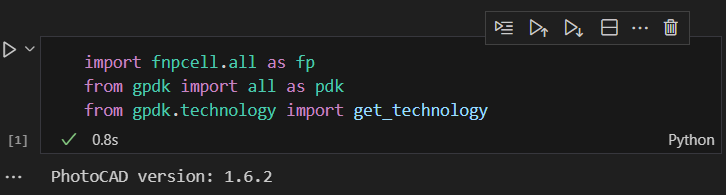
Place
DC_050components in MZICreate
Instanceset,Elementset,Portsetfor components and ports to add in the Device function infnpcell. Then call twoDC_050in pdk namingDC1andDC2, translating their locations and instantiating toinsts. Users can usefp.plotto monitor the cells.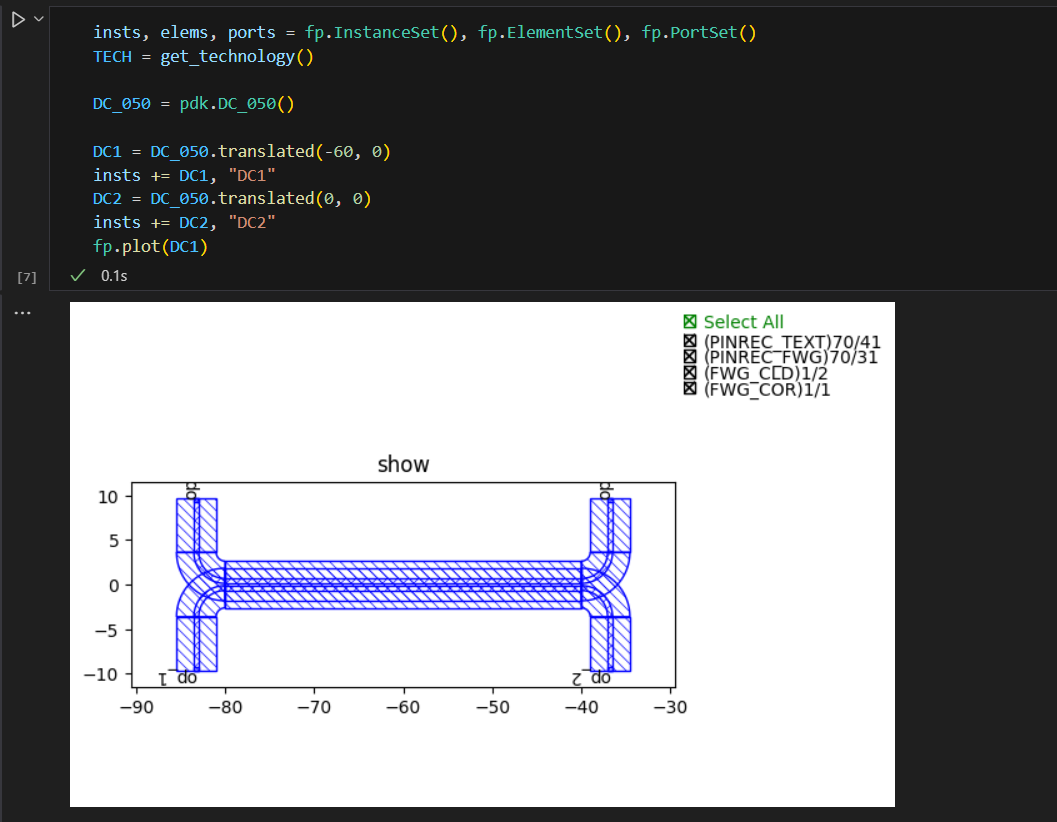
Create links and ports to connect
DC_050in MZIThe scripts here to generate links(
fp.create_links) and ports are the same when using Python IDE environment. However, in the end we have to create a cell reference which contains theinstanceset,elementset, andportsetwe generated above. We can also plot the MZI device by usingfp.plotfunction.links = fp.create_links( link_type=TECH.WG.FWG.C.WIRE, bend_factory=TECH.WG.FWG.C.WIRE.BEND_CIRCULAR, specs=[ fp.LinkBetween( DC1["op_2"], DC2["op_1"], target_length=base_length, ), fp.LinkBetween( DC1["op_3"], DC2["op_0"], target_length=base_length + delta_L ), ], ) insts += links ports += DC1["op_0"].with_name("op_1") ports += DC1["op_1"].with_name("op_2") ports += DC2["op_2"].with_name("op_3") ports += DC2["op_3"].with_name("op_4")
Generate GDS file and plot
Users can also export GDS file of the generated cell after adding the instance set and port set into
fp.Deviceto become a cell. Then to export GDS and plot using the samefp.export_gdsmethod in all the examples.:gds_file = "C:\\LDA\\layout1001\\local\\mzi_jupyter_notebook.gds" library = fp.Library() TECH = get_technology() device = fp.Device(content=[insts], ports=ports) library += device fp.export_gds(library, file=gds_file) fp.plot(library) .. image:: ../images/notebook8.png
Users can download jupyter_notebook_mzi.ipynb for example.